


There are two different side of traders, one who loves simple strategy and the other who rather to choose complicated. They have their own advantages and disadvantages. From my experience, simple strategy is easy to use and doesn't need much interpretation. Of course, sometimes they give more false signal than the complicated system. The other side, complicated system give less false signal. They are harder to use and need a lot of interpretation and exercise.
But whatever strategy we are using, our destination is profit. So, what is yours chooice? Simple or Complicated?
Have you ever read FXTrade Pro's trading strategy at ForexFactory.com? His strategy uses semi martingale lots which is good if you know how to use it. Why we call it semi martingale? Because calculation of the next lots is different from original martingale. In original version, we are doubling the next lots from the previous one. But in FXTrade Pro's strategy, we are not doing the same thing but are still growing the next lots based at our calculations.
Here is the progression of the next lots :

So, what is the main strategy? His strategy uses TakeProfit = 40 and StopLoss = 10 in every sequence with the progression lots. For example, we buy 0.1 lots Eur/Usd at 1.3500 with TP=40 pips and SL=10 pips. This is first sequence. Then our SL is hit. We open the next sequence which is sell 0.1 lots Eur/Usd at 1.3490 with same TP and SL. If our SL is hit once again, we open the next sequence. For better explanation, you can check the picture below.

This simple strategy is very useful if we can combine with other strategy such as break out eagle. We can use our own progression lots depend on our risk ratio and equity. For this purpose, please find the lots calculator in xls format at the link below.
Hint : Use this strategy at brokers company which give you ability to put thin Stop Loss and high leverage margin. (Remember, not all brokers permit us to put SL for 10 pips)
For this strategy, FXTrade Pro already developed an Expert Advisor but it is not free. That's the reason why he was banned from Forex Factory's Forum. Fortunately for my blog's reader, I develop an EA based at his strategy, too. Actually, I develop this EA based at my friend's request, Mr. Duyduy. You can have it for free but use it at your own risk. Please try this strategy and EA at demo first before attach it at live trading.
- You can use it as soon as you activate / attach the EA to the chart
- Or you can input the price which you want the EA to start trading.
Don't forget to visit my blog in other time because I still have some interesting Expert Advisor for you all. Thanks for reading my words.
Download the calculator to count the progression lots : here
Download the Expert Advisor for free : here
Do you know Camarilla Equation? This is seems like ordinary pivot,support and resistance levels. But I heard some rumors that Bank's Traders are using these levels to take positions. This equation is well known in S&P index trading and now traders are bringing this to forex.
HistoryDiscovered in 1989 by Nick Stott a successful bond trader in the financial markets, the 'Camarilla' equation quite simply expounds the theory that markets, like most time series, have a tendency to revert to the mean. In other words, when markets have a very wide spread between the high and low the day before, they tend to reverse and retreat back towards the previous day's close. This suggests that today's intraday support and resistance can be predicted using yesterday's volatility.
Trading with the 'Camarilla' EquationThe Camarilla Equation is for experienced traders and involves you in trading both with and against the trend, using simple rules based around price penetration of the L3 and L4 levels at the bottom of the days range, or the H3 and H4 levels at the top of the day's range. It relies on the fact that success in intraday trading requires you to enter and exit trades with the backing of major support or resistance; the positioning of this resistance being determined by the equation. To use the Camarilla Equation, you enter yesterday's open, high, low and close. The calculation then gives you 8 levels of intraday support and resistance. There are 4 of these levels above yesterday's close, and 4 below as shown below.
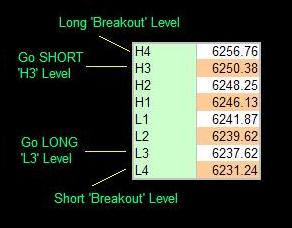
As you can see, trading with the Camarilla Equation is relatively simple. The important levels to note are the 'L3' and 'H3' levels, where you may expect a reversal to occur, and the 'L4' and 'H4' levels that shows you where a major breakout has been confirmed. How you specifically enter a trade depends to a great extent on the way the market opens.
Market Opens INSIDE 'L3'The following applies both to going 'Long' and going 'short'. If the market opens INSIDE the L3 and H3 levels (i.e. BETWEEN the higher H3 and the Lower L3), you must wait for price to approach either of these two levels. Whichever it hits first (L3 or H3) determines your trade.
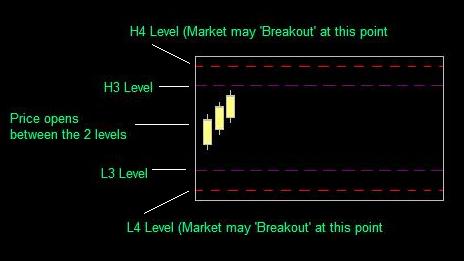
If the HIGHER H3 level is hit, you go SHORT (against the trend) in the expectation that the market is about to reverse. Some traders recommended using the higher 'H4' level as your stoploss point, as a penetration up thru the H4 level actually shows that a major breakout may be under way. I would recommend that you wait for price to bounce back down inside the H3 level again before entering the trade, as you will therefore be technically trading WITH the short-term trend. A fair amount of experience is needed for this style of trading.The opposite, of course applies if the LOWER L3 level is hit first - wait for it to come back up inside the lower L3 level, then go LONG.
Market Opens Outside 'L3'In this case, you wait for the market to move back up thru the L3 level - you will then be trading WITH the trend, and once again, some traders recommended using the L4 level as your stop loss (although perhaps you should use a sensible stop based on your knowledge of your market.)
Taking profits is a matter of personal judgement - just be aware that you WILL want to take profits at some time during the day, because the market is unlikely to 'behave' and stay right-sided for your trade.
Research suggests that these reversals from L3 and H3 happen as often as 4 times out of 5 during intraday trading.
Using the Equation to trade 'breakouts' is also eminently possible, and essentially involves you going LONG if price penetrates UP thru the higher H4 level, or going SHORT if price penetrates DOWN thru the lower L4 level.
Ok so now you know a little about the equation and how to use it, here is what you have all been waiting for so patiently..... The Equation.
H4 = [1.1*(H-L)/2]+CH3 = [1.1*(H-L)/4]+C
H2 = [1.1*(H-L)/6]+C
H1 = [1.1*(H-L)/12]+C
L1 = C-[1.1*(H-L)/12]
L2 = C-[1.1*(H-L)/6]
L3 = C-[1.1*(H-L)/4]
L4 = C-[1.1*(H-L)/2]
Where:
H = Days high
L = Days low
C = Days Close
(All values are for the previous day prior to the trade day)
And now, for forex traders that are using MT4 Platform, there is camarilla indicator for automated calculation and drawing levels. Just download the indicator at link below and put in metatrader/experts/indicator folder, then re run your MT4 Platform and attach the indicator at any charts that you want to use it. Remember, this is not holy grail but can help us to trade and open positions better. Use this as your own risk.
Download link : here

This strategy is based at MTF BBands_Stop indicator and I have found a trading system based on it. This simple strategy is similiar with "Simplicity" which can be found in my previous post here but this is more precise for short term / intraday trading. It can be used for trending or sideways moment but you must learn to find out the pattern for that first.
- Download the zip file here, extract the files in the indicator folder to your MT4 indicators folder that usually like "MetaTrader/ExpertAdvisor/Indicators". Extract the file in the template folder to your MT4 template folder that usually like "MetaTrader/Template".
- Run your MT4 and open a new Gbp/Usd chart. Click the templates icon in the menu bar and choose "MTF bbstops".
- Change your chart to TF 5 Menit.
- Now, the strategy is ready to use.
- See the attached picture above, find out when 2 or more BBands_stop turn into different color, that is the new beginning of new trend. Open your position and place your SL at the highest price at the latest chart before the first indicator change its color.
- You can close / take profit your position by watching the chart pattern that indicates for retrace, using Trailing Stop or with help of Bolinger Bands indicator.
- Notice when a long candle happens, usually there will be a retrace. You may wait to open your position after the retrace happens.
*update 24/03/2008 : you can download the template for MT4 here
Actually, this forex system is based on several indicators that work together to give the same signal. After all indicators confirm the same signal, then we start to open position. The benefit of this system is it works for all pairs especially trending pair.
This system is better used at TF (TimeFrame) H1 to eliminate false signal.
The indicators that needed are BBands_stop_v1, Heiken_Ashi_Smoothed, and SilverTrend_Signal. These are the main indicators.
Ok, lets see the picture below to see how it is works.

Ok, back to the system... We must wait until 3 indicators give the same signal, in this case after down arrow given by Silvertrend_Signal appeared then we must wait until Heiken Ashi and BBands_stops turn red, too.
According to the picture above, there are 3 true and 1 false signals. I admit that there was a false signal appeared. But we must agree that there are no holly grail at forex trading so we must accept a mistake if they are no harm to our trading. I will learn to make this system works better so we can try to eliminate the false signal.


